News /
Benchmarking Open Location Hub with OpenSky and replayed traffic
A repeatable Open Location Hub benchmark built from a five-minute OpenSky Germany capture, replay interpolation, and OTLP telemetry.
We wanted a benchmark built from real traffic, easy to rerun locally, and good at showing where Open Location Hub starts to drop work.
Intro: OpenSky and the benchmark input
OpenSky Network publishes live aircraft state data from a community-operated sensor network. For this benchmark we used the Germany preset, captured about five minutes of traffic, and stored the raw location_updates stream as NDJSON.
The input is both realistic and repeatable. We start from a real capture and replay the same file against the hub whenever we change the runtime.
The dataset and notes live in the hub repository:
- Dataset:
connectors/replay/benchmarks/opensky-germany-2026-04-08/location_updates.ndjson - Capture notes:
connectors/replay/benchmarks/opensky-germany-2026-04-08/README.md
Raw capture totals:
| Metric | Value |
|---|---|
location_updates batches | 90 |
| Raw location updates | 8,367 |
| Unique assets | 687 |
| Unique sources | 687 |
| Average batch size | 92.97 |
| Observed batch size range | 5 to 128 |
| Wall-clock capture window | 284 seconds |
| Average raw ingest rate during capture | 29.45 updates/second |
One detail matters for replay timing: the file was recorded over about five minutes of wall-clock time, but the timestamp_generated values span about 896 seconds. At 1.0x, the replay connector preserves those timestamps, so a straight replay takes about fifteen minutes.
Methodology and goals
The benchmark has three goals:
- Use a real traffic shape instead of an invented load pattern.
- Keep the workload version-controlled so we can rerun it after every runtime change.
- Export enough telemetry to see where overload happens.
For observability, the stack uses standard open source components. OpenTelemetry defines the instrumentation model, and OTLP is the wire protocol used to export metrics, traces, and logs from the hub to a collector. SigNoz is the UI and storage stack we used for these runs, backed by ClickHouse for high-volume telemetry storage and query. That keeps the benchmark independent of any custom hub dashboard or proprietary monitoring endpoint.
Open Location Hub already supports this model directly. The runtime exports
metrics, traces, and logs to an OpenTelemetry-compatible collector, and the
local local-hub
setup wires that into SigNoz by default. In practice, that means we can watch
ingest throughput, queue depth, stage latency, and overload behavior while the
run is executing, instead of reconstructing the story later from a few counters
or ad hoc logs.
The method is simple:
- Capture a few minutes of live aircraft locations from OpenSky.
- Save the raw stream as NDJSON in the repository.
- Replay that file into Open Location Hub with the replay connector.
- Run the same capture at different interpolation rates.
- Watch metrics, traces, and logs in SigNoz while the hub is under load.
For the stress runs we used this replay profile:
TOKEN=$(./local-hub/fetch_demo_token.sh | jq -r .access_token)

env \
  HUB_HTTP_URL=http://localhost:8080 \
  HUB_WS_URL=ws://localhost:8080/v2/ws/socket \
  HUB_TOKEN="$TOKEN" \
  uv run --project connectors/replay python connectors/replay/connector.py \
    --input connectors/replay/benchmarks/opensky-germany-2026-04-08/location_updates.ndjson \
    --interpolation-rate-hz 10.0 \
    --batch-window-ms 25 \
    --max-batch-size 256
We also tracked derived event volume during the run. The aircraft feed does not stay raw for long:
| Derived output | Count |
|---|---|
| Fence event batches | 133 |
| Fence events | 7,557 |
| Collision event batches | 1,136 |
| Collision events | 160,869 |
Without synthetic data
The raw capture itself is small enough to understand:
8,367original location updates687unique assets- about
29.45raw updates per second during capture
That is useful as an input, but it does not expose the next runtime ceiling quickly. The value of the benchmark comes from starting with real movement and replaying the same trajectories at higher point density.
For this baseline run, the SigNoz dashboard window is pinned to the live
capture interval (07:39:00Z to 07:45:30Z) rather than a generic “last N
minutes” view:
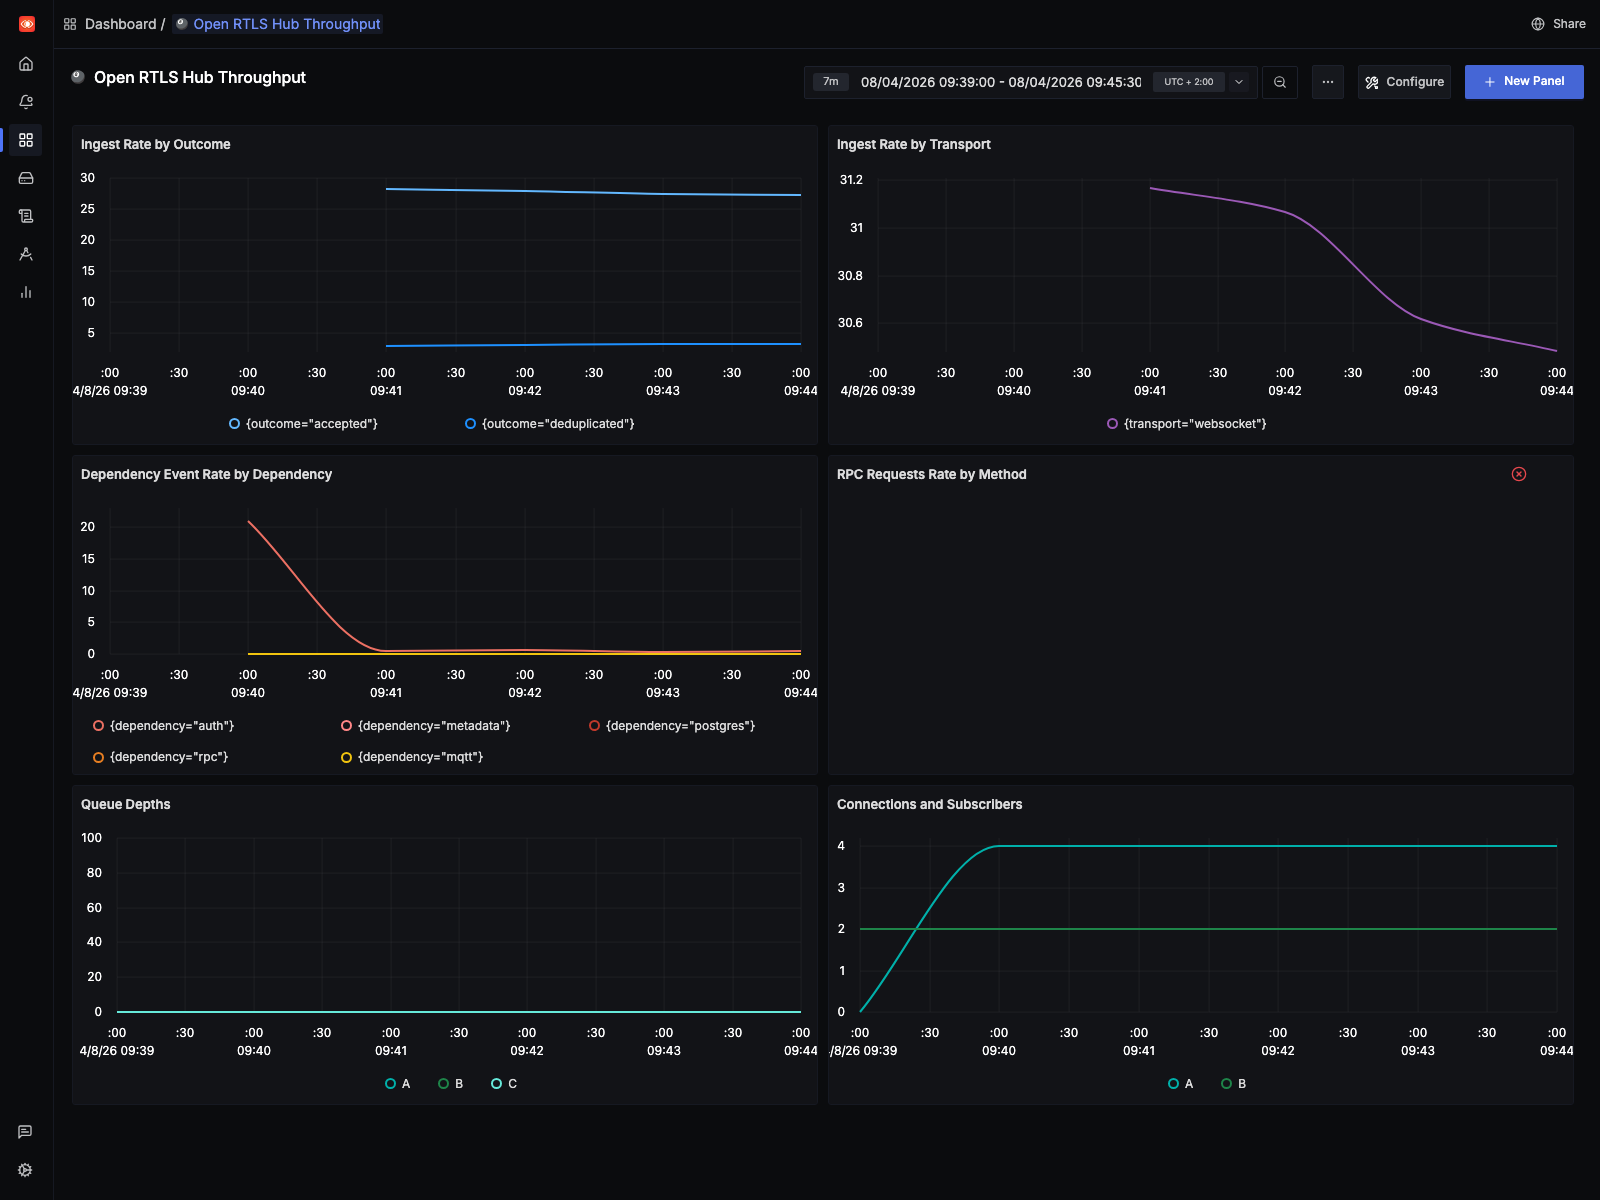
- the live capture stays close to the raw source rate
- the
10 Hzreplay drives ingest into the low thousands per second and pushes queue depth sharply higher - the
1 Hzreplay stays an order of magnitude lower and completed without adding queue drops
Queue drops are still easier to see in logs and runtime counters than in metrics. That missing telemetry is now tracked in the backlog.
1 Hz
The 1 Hz profile is the current reference point for a clean run on this machine.
| Metric | Value |
|---|---|
| Total replay emissions | 159,740 |
| Synthetic interpolation points | 151,372 |
| Expansion factor | 19.09x |
| Completion time | 901.26s |
At 1 Hz, the hub completed the replay without increasing the drop counters. That makes it a good sustainability profile for regression checks: heavier than the raw input, but still clean.
The SigNoz view for this run uses the exact replay window (08:34:37Z to
08:49:38Z):
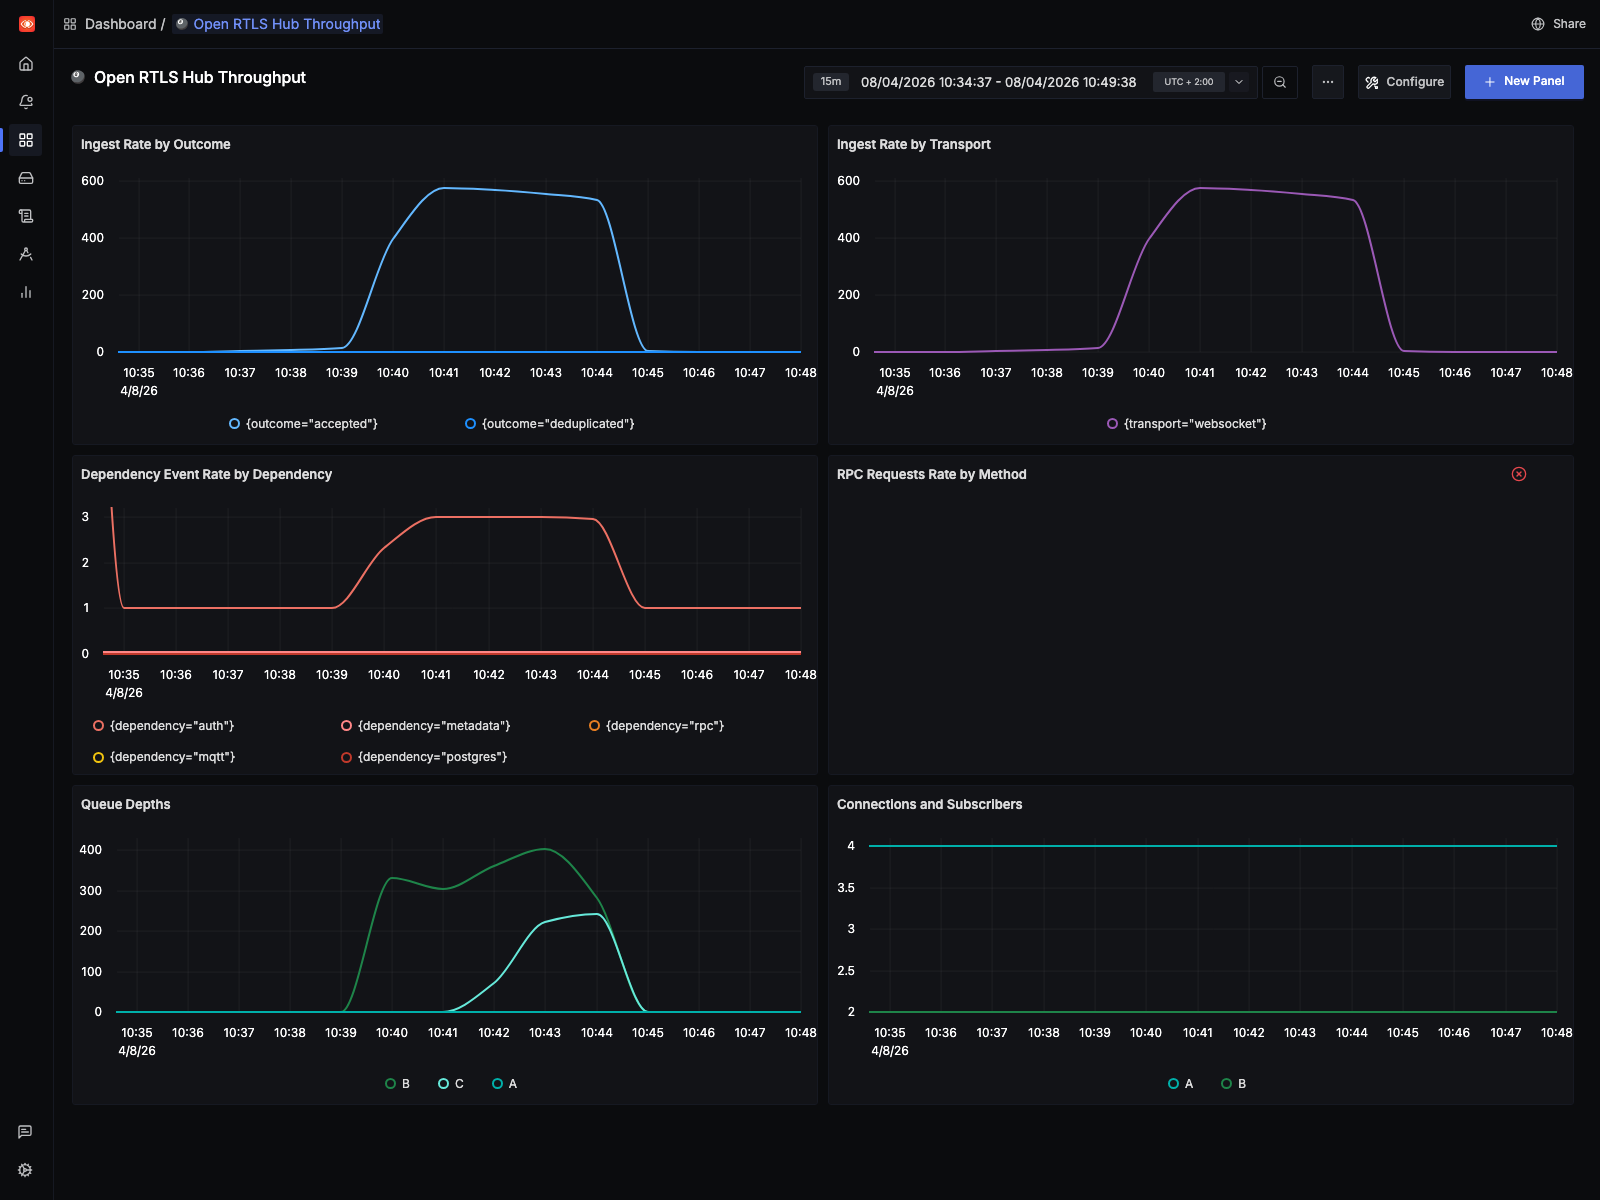
This is the shape we want from a healthy regression run: sustained elevated throughput without the queue pressure and drop behavior that shows up in the stress profile.
10 Hz
The 10 Hz profile is the stress case:
| Metric | Value |
|---|---|
| Original replayed updates | 8,367 |
| Synthetic interpolation points | 1,572,810 |
| Total replay emissions | 1,581,177 |
| Expansion factor | 188.98x |
| Completion time | 672.50s |
On the benchmark machine, CPU usage stayed around 40-50% across 16 CPUs while the runtime still started dropping work. That points away from a simple “we ran out of CPU” explanation.
The main pressure signals looked like this:
| Queue pressure signal | Observed value |
|---|---|
| Decision queue drop counter | 646,900+ |
| Native queue drop counter | 7,000+ |
| Decision queue drop warnings in runtime log | 6,647 |
| Native queue drop warnings in runtime log | 117 |
That is the main result of the benchmark. The 10 Hz run exposes a decision-path bottleneck long before the host is fully saturated. The 1 Hz run does not.
The SigNoz view for the stress run uses the exact replay window (07:49:00Z
to 08:01:00Z):
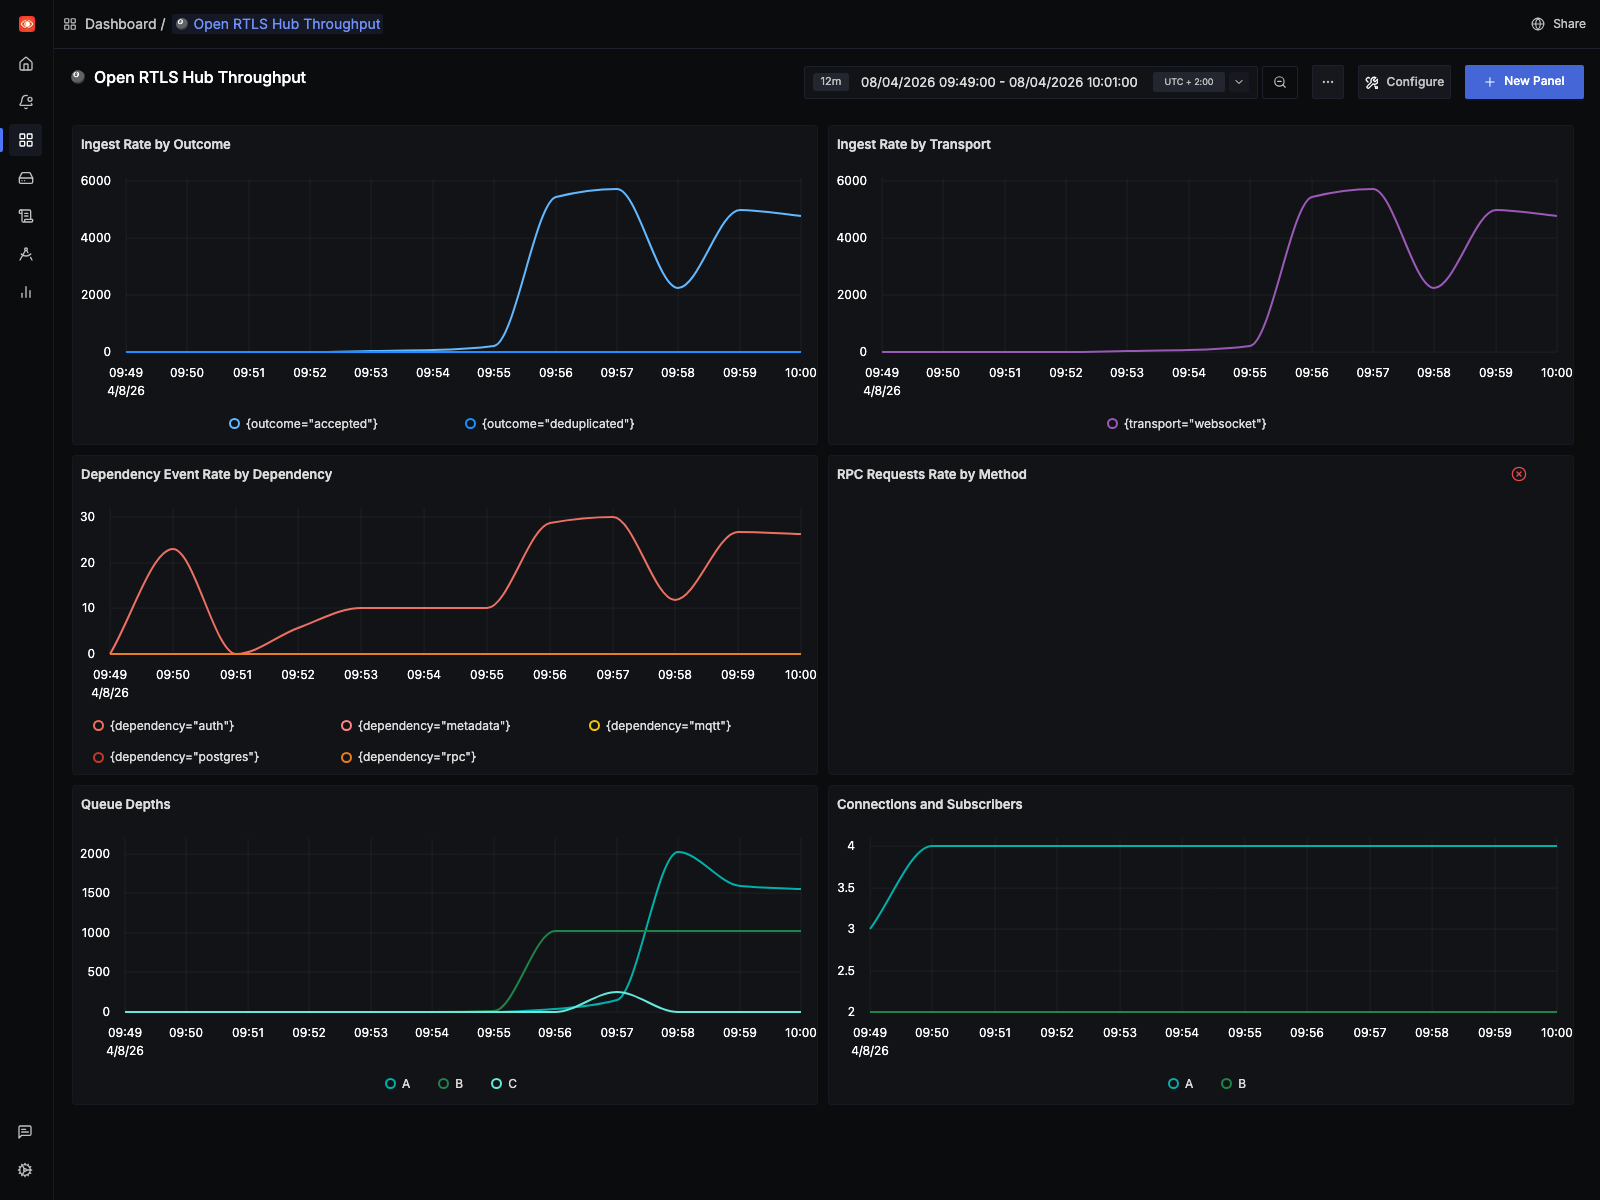
That screenshot makes the operational difference visible quickly: ingest rises far above the live baseline, queue depth ramps hard, and the runtime enters a drop-heavy regime before host CPU is fully exhausted.
This benchmark was only possible because earlier runtime work had already removed some simpler bottlenecks:
- Replay-side batching in the replay connector via
--batch-window-msand--max-batch-size, so the stress tool does not waste work on tiny WebSocket publishes. - WebSocket outbound batching in the hub, reducing per-event dispatch overhead during fan-out.
- A dedicated native publication queue in the hub, so ingest is not tightly coupled to every downstream consumer.
- A separate decision queue, so fence and collision processing can lag independently from native publication.
- Buffered downstream processors with explicit drop accounting for non-critical overload behavior instead of hidden backpressure.
- OTLP metrics, traces, and logs wired into SigNoz so the benchmark can be inspected live instead of inferred from a few runtime counters.
Learnings, mitigations, and future work
Three things are clear from this run.
First, the benchmark method is worth keeping. It starts from real traffic, lives in the repository, and can be rerun against the same dataset after each runtime change.
Second, the current ceiling is in the decision path, not in raw host CPU. The likely causes are limited parallel drain capacity, serialization in the hot path, and too much per-update work for dense replay.
Third, the telemetry still needs work. We could see overload in logs and counters, but not every signal was exported cleanly enough for dashboards and automated checks.
That maps directly to current work in the public backlog:
- Issue #41: Profile and raise the decision-stage throughput ceiling under dense replay load covers profiling, higher parallel drain capacity, better batching, and reducing repeated per-update work.
- Issue #42: Export queue drop and drain metrics for replay and overload analysis covers the missing OTLP metrics and dashboard signals that became obvious during this benchmark.
- Issue #37: Publish a repeatable alpha performance baseline for CRUD, ingest, MQTT, and RPC extends this into a broader, repeatable performance baseline for the repository.
- Issue #38: Profile and improve WebSocket subscription matching under high-cardinality fan-out covers a related scaling path on downstream fan-out.
The practical mitigation for now is simple:
- keep
1 Hzas the clean reference profile - keep
10 Hzas the failure-boundary profile - use both after runtime changes
- treat queue drops as a first-class regression signal
Run it yourself
If you are building an omlox hub or any other location backend, you can run the same benchmark against your own implementation.
Start with the saved OpenSky capture and the replay tooling in the public repository:
If your implementation can ingest omlox-style location traffic, this dataset gives you a concrete place to start. Run it at the raw profile, at 1 Hz, and at 10 Hz, then compare throughput, drops, latency, and downstream event behavior against your own runtime.